As publicly funded entities, school districts have a responsibility to engage with their communities. Transparency and accountability are fundamental pillars for fostering trust and collaboration between school districts and their stakeholders. Involving the community of stakeholders is a critical part of good governance for superintendents and school boards.
One powerful tool that promotes these values is the use of dashboards to share data with the public. Data plays a vital role in shaping and improving the educational landscape. Publishing public data allows stakeholders, especially families, to understand how students are faring. External-facing dashboards contribute positively to and reflect a district's data culture as well.
Why Have Public Dashboards?
When school districts share data through dashboards, several advantages come to light:
- Enhanced Trust: Publicly accessible dashboards allow parents, students, teachers, and community members to gain insights into the educational system's performance. This leads to increased trust in the district's operations and decision-making processes.
- Informed Decision Making: Data dashboards provide users with valuable information, empowering them to make informed decisions regarding school selection, resource allocation, and policy advocacy. This fosters a sense of ownership and involvement among stakeholders.
- Improved Collaboration: Dashboards facilitate collaboration between districts and their communities by creating a common platform for communication and feedback. This enables a collective effort towards improving educational outcomes and addressing challenges.
- Increased Accountability: Transparently sharing data holds school districts accountable for their performance and progress. By openly showcasing metrics such as student achievement, attendance rates, and graduation rates, districts are motivated to strive for continuous improvement and make data-driven decisions.
Best Practices for Implementing Data Dashboards
To maximize the benefits of sharing data through dashboards, school districts should follow these best practices:
- Define Clear Goals: Determine the specific objectives of the dashboard, such as improving community engagement, identifying achievement gaps, or monitoring resource utilization. Clear goals provide a framework for selecting relevant metrics and visualizations.
- Select Key Metrics: Choose a set of key performance indicators (KPIs) that align with the district's goals. These may include student achievement data, attendance rates, dropout rates, college readiness, and demographic information. Ensure that the selected metrics are easily understandable by the general public.
- Design User-Friendly Dashboards: Develop dashboards that are intuitive, visually appealing, and accessible across various devices and platforms. Use interactive visualizations, graphs, and charts to present data in a meaningful way. Consider providing context and explanations for each metric to ensure clarity.
- Maintain Data Accuracy and Timeliness: Establish robust data collection and validation processes to ensure the accuracy and integrity of the information displayed on the dashboard. Implement automated data feeds and regular updates to provide real-time or near-real-time data.
- Engage Stakeholders: Actively involve stakeholders in the dashboard development process. Seek feedback and input from parents, students, teachers, administrators, and community members to ensure that the dashboard meets their needs and addresses their concerns.
Best Metrics to Include
While the specific metrics to include in a public-facing dashboard may vary based on the unique needs and priorities of each school district, there are several essential metrics that can provide a holistic understanding of the district's performance. Here are some key metrics to consider:
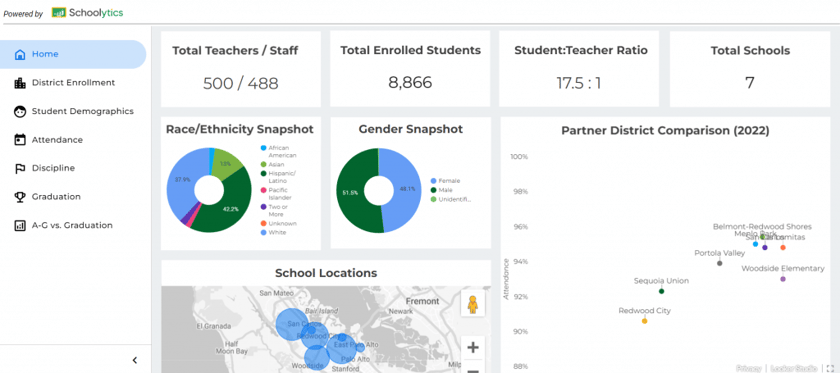
- Enrollment Summary: Including a simple overview of the district’s profile, such as the number of students and staff, and the number of schools, sets a baseline understanding for the members of the public.
- Academic Achievement: Displaying data on student performance, such as standardized test scores, graduation rates, and college acceptance rates, provides insights into the district's effectiveness in preparing students for future success.
- Student Attendance and Engagement: Monitoring attendance rates and tracking student engagement metrics, such as participation in extracurricular activities or advanced courses, highlights the district's efforts to promote student engagement and create a conducive learning environment.
- Equity: Providing data on student outcomes by subgroups—like race/ethnicity, gender, socioeconomic status, and home language status—shows the district’s commitment to transparency and educational equity.
- Financial Transparency: Sharing financial information, such as budgets, expenditures, and revenue sources, ensures transparency and builds trust among stakeholders, showcasing responsible financial management.
- School Safety and Discipline: Highlighting metrics related to disciplinary incidents, bullying reports, and safety measures implemented within schools reassures parents and the community about the district's commitment to providing a secure learning environment.
- Parent and Community Engagement: Including metrics on parent involvement, community partnerships, and feedback mechanisms demonstrates the district's dedication to fostering meaningful connections and collaborative relationships with parents and the wider community.
- Progress on Strategic Goals: Showcasing progress towards specific goals outlined in the district's strategic plan helps stakeholders understand the district's vision, priorities, and overall progress towards achieving those goals.
- "Comparables" Analysis: Giving the community insights on how the district compares to neighboring districts or similar districts nearby can spark informed discussions about resource allocation and goals.
The Nuts and Bolts of Dashboard Building
Producing public dashboards presents districts with a classic "build/buy/partner" decision. What a district chooses depends on their budget and priorities:
- In-House Development: In-house dashboard development gives the district a lot of control but does require time and resources. If the district has a skilled in-house IT team, they can develop a custom dashboard solution using programming languages, databases, and visualization tools and pull data from different sources within the district, such as student information systems (SIS). Open-source tools and frameworks for building dashboards, such as D3.js, Tableau Public, or Grafana provide flexibility and customization options while lowering costs. Alternatively, a staff member can create simple data visualizations in Excel or Google Sheets, or take a screenshot of dashboards in relevant platforms like the SIS, and post those images on a district webpage. This highly manual option is not recommended.
- Collaborative Efforts: Districts can solicit help from the local community to build the dashboards. For example, universities, technology companies, or individuals like parents may be willing to volunteer their time. This collaboration can bring expertise, resources, and innovative ideas to the project, but also leaves the district vulnerable when that volunteer is no longer able to help out.
- Vendor Solutions: Third-party vendors who specialize in educational data management and visualization, like Schoolytics, provide user-friendly dashboard platforms that can be customized to the district's requirements. Cloud-based dashboard solutions offer scalability, accessibility, and data security. Although the district gives up some autonomy when outsourcing, these solutions can save time and resources by leveraging existing infrastructure and expertise and by maintaining the data pipelines and dashboard interface.
Key Challenges
There are some key challenges when it comes to creating and maintaining public dashboards:
Data concerns:
- Concerns about privacy may arise when sharing sensitive information.
- Ensuring data accuracy and consistency can be challenging.
Controlling the narrative:
- The complexity of data analysis may hinder understanding for some users.
- Misinterpretation of data or overreliance on metrics may occur.
Resource allocation:
- Developing and maintaining dashboards require time, resources, and technical expertise.
- The systems where student data is typically stored can be challenging to work with.
Schoolytics as a Solution
To help districts solve these challenges, Schoolytics has begun offering schools and districts a service to build and maintain their public-facing dashboards. By integrating disparate data sources, Schoolytics enables school districts to unlock the full potential of their data and present comprehensive insights through user-friendly dashboards. Schoolytics offers several advantages:
- Customizable Dashboards: With Schoolytics, school districts can create customized internal and external dashboards that align with their specific goals and metrics. The platform provides a range of visualization options, enabling districts to present data in a meaningful and engaging manner.
- Data Integration: Schoolytics seamlessly integrates data from multiple sources, eliminating the need for manual data transfers or complex integration processes. This ensures accurate and up-to-date information for the dashboards.
- Data Privacy and Security: Schoolytics prioritizes data privacy and security, adhering to industry standards and regulations. The platform employs robust encryption and access controls to protect sensitive student information.
School districts have a responsibility to be transparent and accountable to their stakeholders. Data dashboards serve as powerful tools for achieving these goals by providing easily accessible, visually appealing, and informative representations of educational data. By embracing best practices and using a tool like Schoolytics to support this effort, districts can enhance community engagement, foster trust, and drive continuous improvement. While challenges exist, the advantages of transparency and accountability far outweigh the potential drawbacks. By leveraging the power of data dashboards, school districts can create a collaborative educational ecosystem that benefits all stakeholders and paves the way for educational excellence.
As part of our Unified Data Platform, Schoolytics offers affordable public-facing dashboards that are easy to set up and deploy on your district or school website. If you’d like to learn more and see a demo, get in touch with our team.