
Schoolytics Resource Hub
Here at Schoolytics, we’re data nerds at heart. So when we’re not building powerful tools to help educators turn classroom data into action, we’re synthesizing what we’ve learned along the way into useful resources for teachers, coaches, and administrators.
.png?width=500&height=500&name=hero%20image%20(2).png)
CASE STUDY
Sequoia Union High School District
Explore how SUHSD is taking their data strategy to a new level with the breadth of data and customization services offered by Schoolytics.
RESOURCE
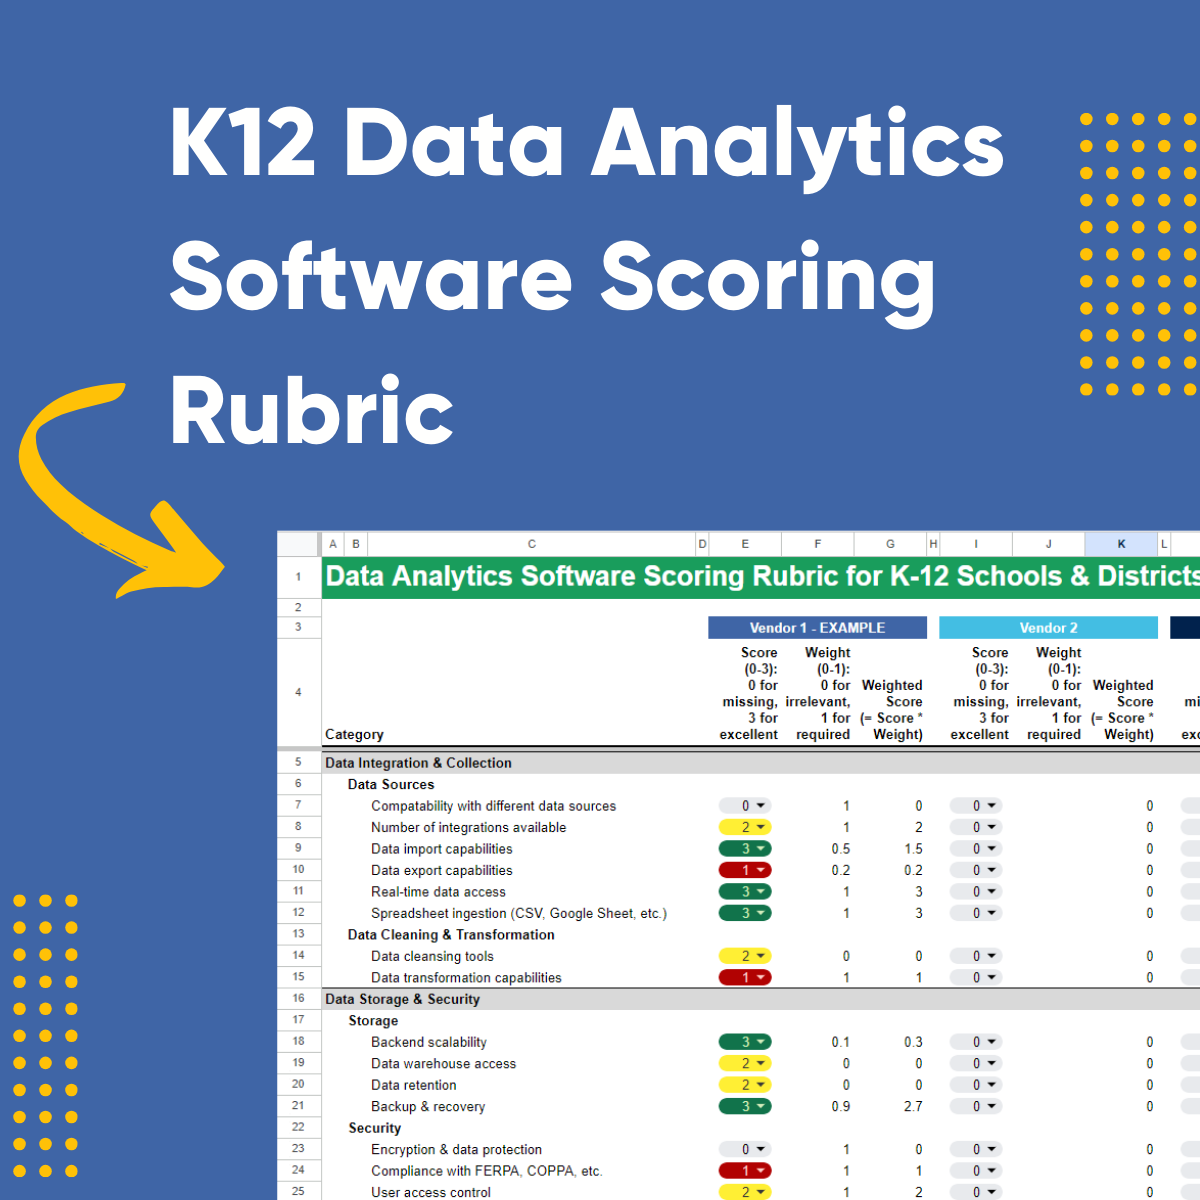
Scoring rubric for data analytics software
Access this scoring rubric spreadsheet to help you evaluate vendors when your school or district is buying data analytics software. Read the blog post as well!
CASE STUDY
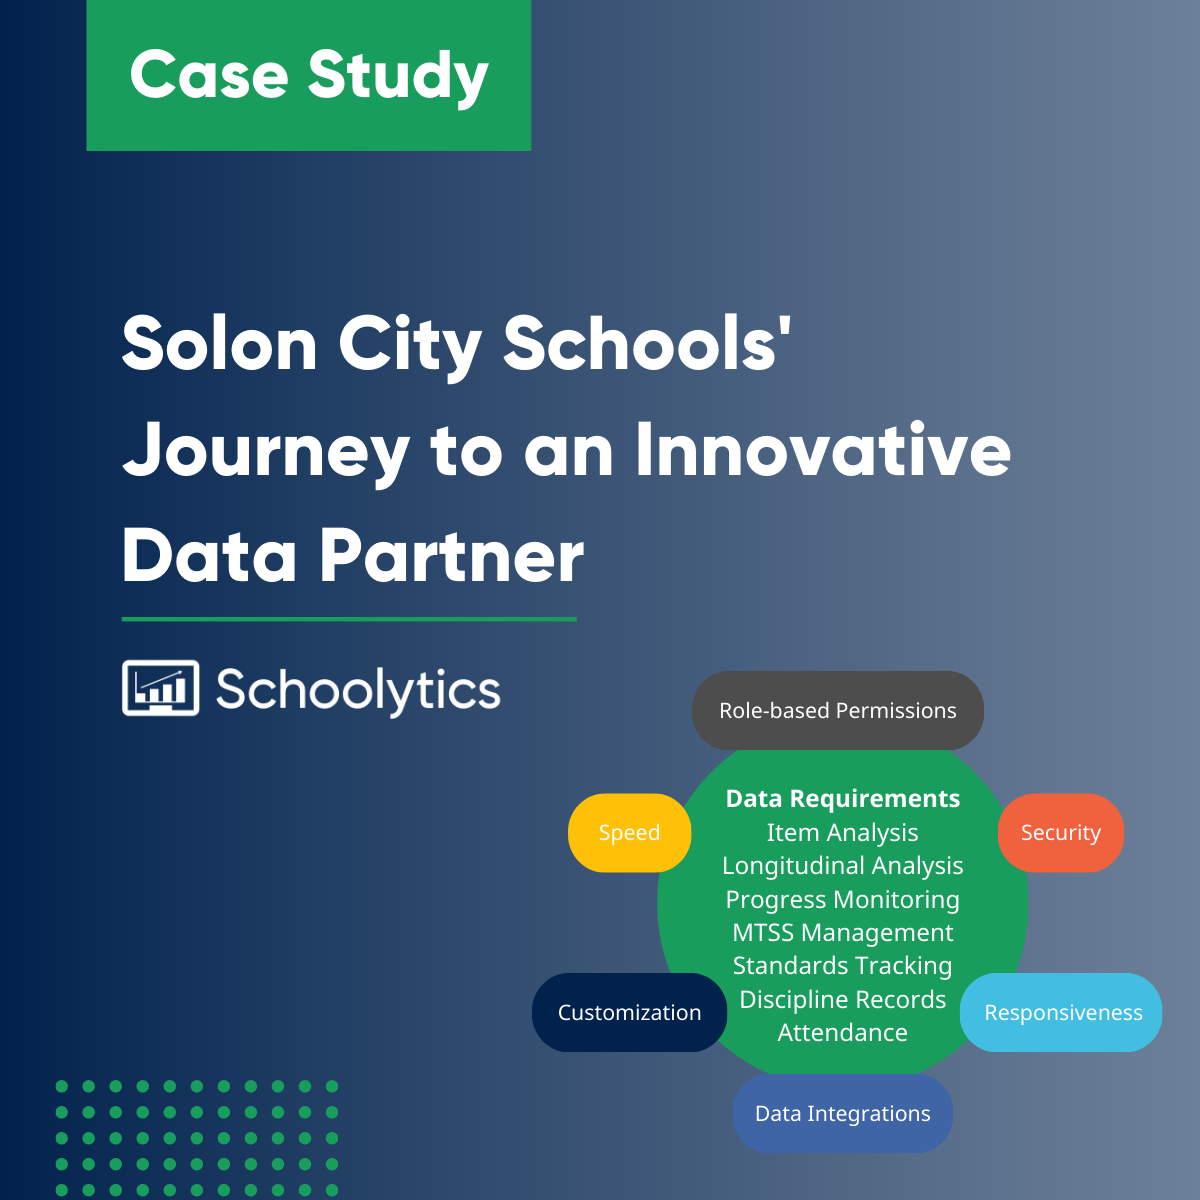
Solon City Schools
Explore how Solon City Schools, seeking innovation and customization, chose Schoolytics as their new data partner.

CASE STUDY
Portland Public Schools
Learn how Portland Public Schools (ME) found an oasis of insights in their school data using the Schoolytics Unified Data Platform.
CASE STUDY
Meade County High School
Learn how Meade County High School increased assignment completion by a factor of 1.5x for students by using Schoolytics.
.png?width=2000&height=1125&name=teacher-workloads-hero%20(1).png)
INFOGRAPHIC
Trends in Teacher Workloads
It’s easy to assume that teachers spend most of their time, well…teaching. But on average, teachers only spend 49% of their time directly interacting with students.
So how do teachers spend the other 51%? And how does that contribute to growing workloads and burnout? Access our research based on LMS data to find out.
INFOGRAPHIC
Trends in Student Workloads
Using our unique data from learning management systems (LMSs), we took a detailed look at students’ workload in the 2021-22 academic year.

INFOGRAPHIC
2023 Edtech Landscape
With edtech tools becoming more ubiquitous in classrooms around the world, we wanted to figure out which solutions are the most used and most effective based on student outcomes.
RESOURCE
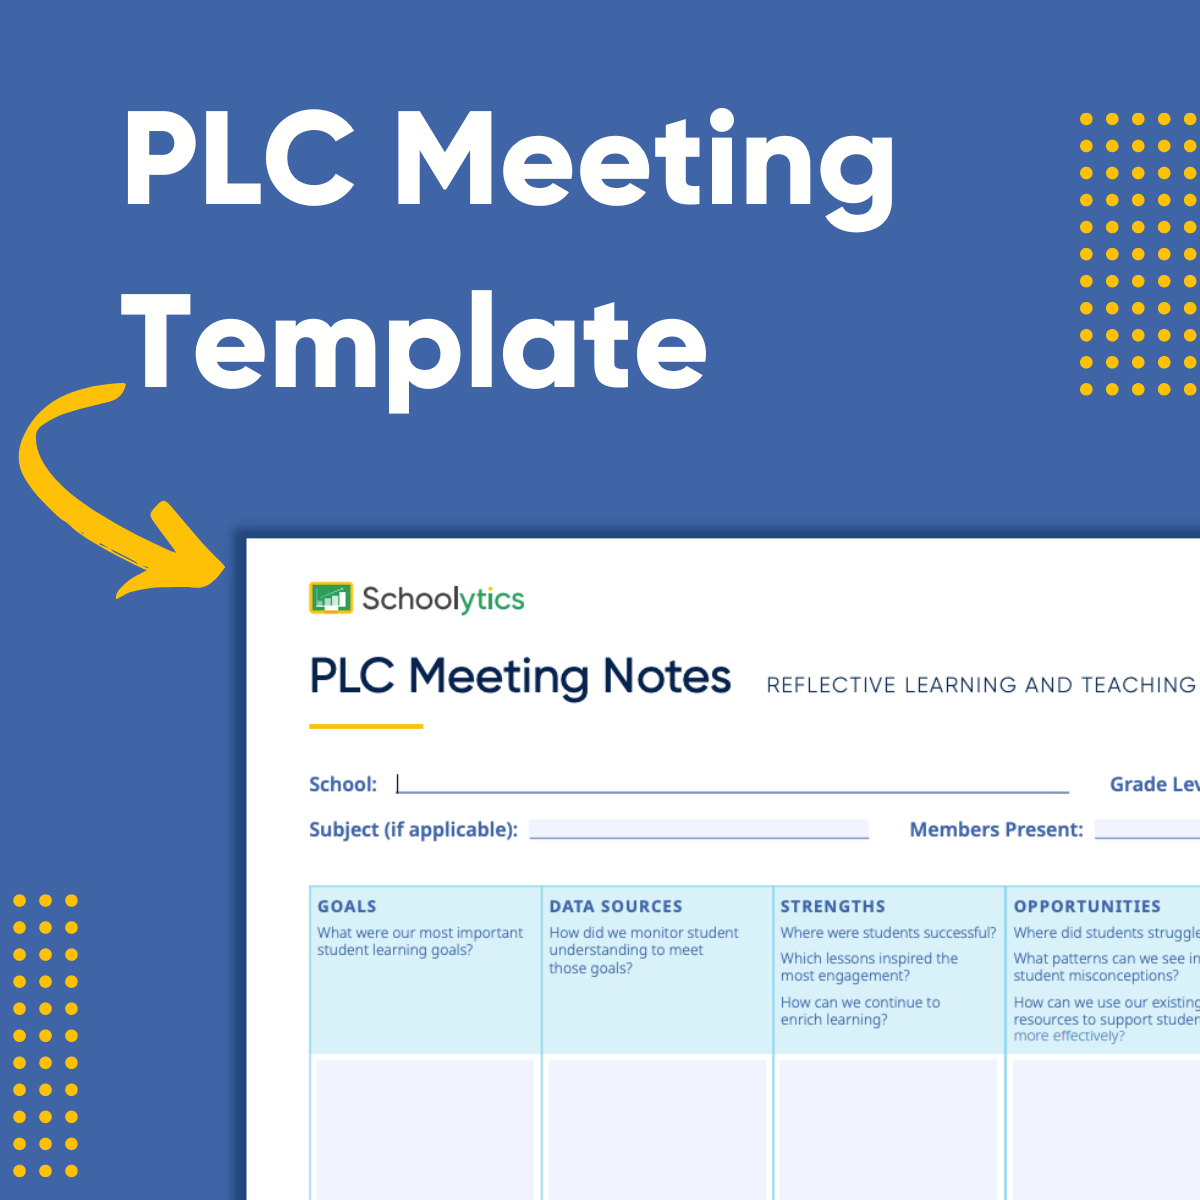
PLC Meeting Template
This professional learning community (PLC) meeting template is interactive and printer-friendly. Use it to take notes during your PLC meetings when discussing data. It's full of useful links to the Schoolytics platform.
INFOGRAPHIC
Trends in LMS Usage
With edtech tools becoming more ubiquitous in classrooms around the world, we wanted to figure out which solutions are the most used and most effective based on student outcomes.
BLOG POST
Google Cloud Partnership
Learn about how Schoolytics uses the Google Cloud Platform as the backbone of a flexible, scalable data architecture.


INFOGRAPHIC
Chronic Absenteeism
Students are missing more school days than ever. Get a primer on these trends in our detailed infographic on chronic absenteeism.

