

Learning management systems (LMS) are designed for teachers to share materials and assignments with students, and for students to submit those assignments. Teachers often, but not always, also use the LMS to grade student submissions and return work and feedback to their students.
What LMSs typically lack is in-depth analytics and insights based on the constant stream of data generated by the system itself. This is unfortunate because LMS data is both frequent and informative, but only if you can get it in a usable format.
With this data, you can create metrics for overall assignment completion for students, the rate of on-time completion by students, students’ grade averages, and the share of assignments that teachers have graded. A good reporting tool will also allow users to drill down from one report to the next, going deeper and deeper to find out more and more details on how students and teachers are doing.
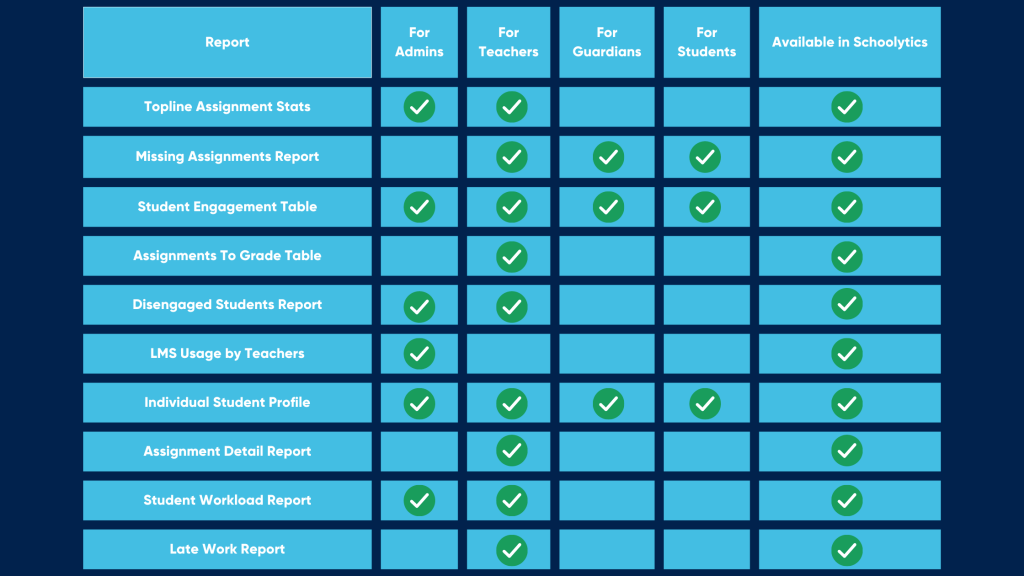
A summary of key metrics across all classes and students. These stats show teachers how their students are faring at a glance and can serve as a good indicator of overall student performance.
Who it’s for: Teachers, Administrators
Example in Schoolytics
A report for students’ missing assignments. A favorite among teachers, this table shows how many assignments every student is missing. Ideally, it can be filtered for a date range, since most often, assignments must be turned in by the end of the term. Since homework completion is typically a critical portion of a student’s class grade, this report helps teachers give students extra support to get their work turned in and earn points toward their final grade.
Who it’s for: Students, Guardians, Teachers
Example in Schoolytics
A table of how every student is doing on their assignments. This report is a key part of measuring student learning and progress. Metrics like the percent of assignments completed, the rate of on-time completion, and grade averages—as well as change over time—are all useful data points for educators, guardians, and even students themselves. Variations on this table include a student honor roll for top performers.
Who it’s for: Students, Guardians, Teachers, Instructional Coaches, Administrators
Example in Schoolytics
A table of assignments that still need to be graded and returned to students. Teachers love this table because it shows assignments across classes, and not just by class (a limitation of many LMSs). Clever filtering can also exclude assignments that were never meant to be graded, thereby reducing distractions and keeping teachers laser-focused on giving students timely, meaningful feedback.
Who it’s for: Teachers
Example in Schoolytics
A list of students who are falling behind on work and have not submitted work during a specified timeframe. These “disengaged students” need immediate intervention to determine the root causes and get them back on track. Low assignment completion can be the proverbial canary in the coal mine for learning issues.
Who it’s for: Teachers, Instructional Coaches, Administrators
Example in Schoolytics
A tally of how many assignments teachers are creating, assigning, and grading. To support teachers’ adoption of the LMS, it’s important to measure how much they’re using the platform. This type of report can reveal who needs more training and what functionalities are underutilized.
Who it’s for: Instructional Coaches, Administrators
Example in Schoolytics
A summary of performance for an individual student. Often missing in the LMS, student profiles are valuable tools for understanding one student more deeply. It’s possible to spot patterns in work completion over time or see whether students’ performance across classes is consistent or variable.
Who it’s for: Students, Guardians, Teachers, Instructional Coaches, Administrators
Example in Schoolytics
A table of all assignments. This table shows the status of every assignment, with information on how many students have been assigned the work, how many have made submissions, and how many of those submissions have been graded by the teacher.
Who it’s for: Teachers, Instructional Coaches
Example in Schoolytics
A report showing how many assignments students have due and how many assignments they are submitting on given days. With student mental health at historic lows, teachers and administrators can track how much work students are assigned, and how much they’re able to turn in. If these numbers are very unbalanced, i.e., students are unable to keep up with their work, it’s important to investigate the barriers to assignment completion.
Who it’s for: Teachers, Instructional Coaches, Administrators
Example in Schoolytics
A report showing the count of late assignments for every student. Due to LMS limitations, it’s easy for teachers to miss late work submissions because they come in outside of the normal workflow.
Who it’s for: Teachers
Example in Schoolytics
Learning management systems are a rich source of data and insights for your school district, but separating the signal from the noise can be challenging without a student data platform that automatically contextualizes that data for you. Without one, you might find yourself spending too much time manually synthesizing the data to effectively make decisions based on the insights you uncover.